Use Infographics to Get Results | Visual Storytelling

Use Infographics to Get Results
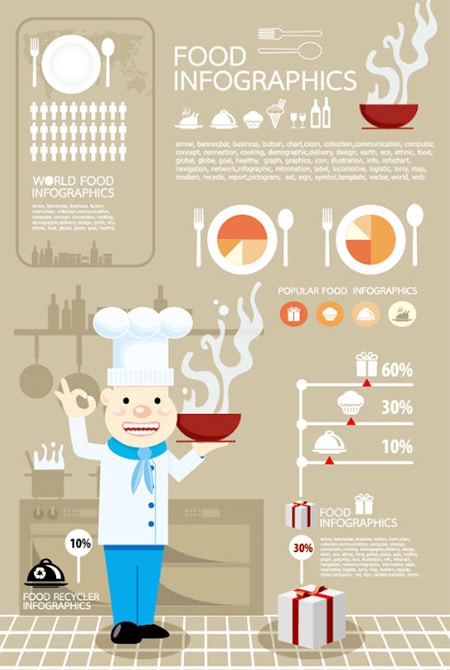
food-infographics If you are an online business owner and you want to engage your readers, making it easier for them to understand complex jargon as it relates to your product or service, the best option is to use Infographics. It helps you to describe things clearly, precisely and speedily. Infographics are similar to using signs, presenting data and maps. This type of correspondence is used by various professionals including:

  • Online marketers
  • Technical writers
  • Statisticians
  • Scientists
  • Educators

The Benefits

Infographics provide many benefits such as:

  • Simple to develop
  • Excellent organization
  • Good record keeping
  • Great communication of conceptual information

If you want to convey specific information in a clear and concise manner, words may not be enough. People will sometimes grasp a concept better when it is visual. It will capture their imagination, making the information more logical.

The History

Infographics has been around for a long time, but until recent years, it has just seen much use on the Internet. If you can indulge the idea that you have seen television ads, manuals, road signs, newspaper ads, visual art description in books and on billboards, you will agree that this type of communication with infographics has been around for a long time. These days, you will see more infographics online, even more so from the science and technology industries.

Effective Delivery
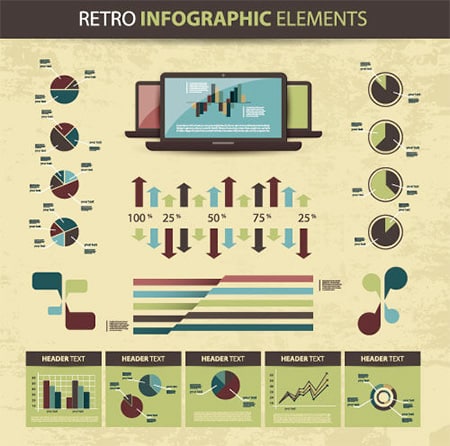
retro-infographics Infographics must be done to deliver information effectively to the public. That is why it is important to make it simple and not overly complex or you are defeating the purpose of it. The simpler that you make it, the more clearer, concise and cleaner it will be. The information must be organized in such a way as to convey the information in steps. The reader will be following each step and at the end, it will make more sense.

Conclusion

With your infographics, you need to develop a plan on how you will construct the model. Then you have to use cause and effect to present the information. If you want to keep the information fresh in the minds of your readers, then it is best to present it so that it depicts the cause and shows the results and effects. For example, an infographics was done online to show what caused the last recession in America. It was done to capture the reader’s attention and was effective in portraying the details so that it remains in the reader’s mind. Even someone from another country should understand the chain of events in your infographics.
blogs

Use Infographics to Get Results

food-infographics If you are an online business owner and you want to engage your readers, making it easier for them to understand complex jargon as it relates to your product or service, the best option is to use Infographics. It helps you to describe things clearly, precisely and speedily. Infographics are similar to using signs, presenting data and maps. This type of correspondence is used by various professionals including:

  • Online marketers
  • Technical writers
  • Statisticians
  • Scientists
  • Educators

The Benefits

Infographics provide many benefits such as:

  • Simple to develop
  • Excellent organization
  • Good record keeping
  • Great communication of conceptual information

If you want to convey specific information in a clear and concise manner, words may not be enough. People will sometimes grasp a concept better when it is visual. It will capture their imagination, making the information more logical.

The History

Infographics has been around for a long time, but until recent years, it has just seen much use on the Internet. If you can indulge the idea that you have seen television ads, manuals, road signs, newspaper ads, visual art description in books and on billboards, you will agree that this type of communication with infographics has been around for a long time. These days, you will see more infographics online, even more so from the science and technology industries.

Effective Delivery

retro-infographics Infographics must be done to deliver information effectively to the public. That is why it is important to make it simple and not overly complex or you are defeating the purpose of it. The simpler that you make it, the more clearer, concise and cleaner it will be. The information must be organized in such a way as to convey the information in steps. The reader will be following each step and at the end, it will make more sense.

Conclusion

With your infographics, you need to develop a plan on how you will construct the model. Then you have to use cause and effect to present the information. If you want to keep the information fresh in the minds of your readers, then it is best to present it so that it depicts the cause and shows the results and effects. For example, an infographics was done online to show what caused the last recession in America. It was done to capture the reader’s attention and was effective in portraying the details so that it remains in the reader’s mind. Even someone from another country should understand the chain of events in your infographics.

About the Author
Bjorn Wallman
As the CEO of Once Interactive, a highly regarded digital marketing agency, Bjorn possesses a deep understanding of the ever-evolving landscape of SEO. He has successfully guided numerous companies towards achieving higher search engine rankings, increased organic traffic, and improved online visibility.

categories